When an individual has their lung function measured for the first time the clinician will want to know if the result is unusual for that individual. The clinician needs to know if the result is within the expected range for someone of their age, sex, height and ethnicity (all factors known to influence their lung function results). The best method to determine whether the result is unusual is to calculate how far the subject's result is from their predicted value and then express this in terms of the number of standard deviations their value is from their predicted. This result is called the "Standardised Residual" (SR) or the z-score and is given by:
SR = (Recorded Value - Predicted Value) / RSD
RSD is the residual standard deviation, that is the standard deviation of all the "residuals" from the data used to derive the prediction equation used, where "residual" refers to the difference between a given subject's result and their predicted value.
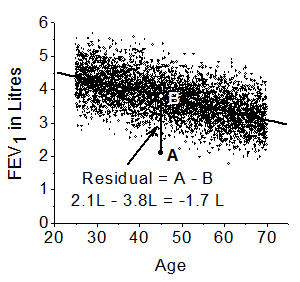
The Figure to the right shows over 1000 data points for normal healthy male subjects' FEV1 values used to create predicted values. A male patient's FEV1 value, point A, is 2.1 L and this patient has a predicted value, point B, of 3.8L and so the patient's residual is (A - B), which is (2.1 - 3.8) = -1.7L. This residual is then standardised by the spread of all the residuals, that is the RSD, found in this male population used for making the prediction. For these data the RSD = 0.51L, so the SR value is -1.7/0.51 = -3.3 .
Calculating the predicted value is usually done using a prediction equation taken from a large population of comparable subjects who have never smoked. The GLI-2012 equations are derived from over 70,000 subjects and give the most reliable predictions for European subjects based on their sex, age, height and ethnicity [14]. The GLI-2012 equations return the z-scores (SR values) given the subject's sex, age, height and ethnicity.
Plot of FEV1 data showing definition of a residualHaving obtained the z-score or SR value for a subject's lung function index we can determine how their result relates to population norms. The figure on the right shows a Gaussian distribution for the z-scores of FEV1 found in a normal healthy population. A z-score of -1.645 defines the lower 90% confidence limit for
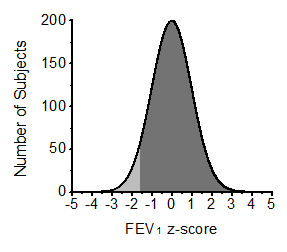 such a distribution and the pale grey area covers all the values below this level and represents 5% of the total area under the curve and so 5% of a 'normal healthy population' will have a lung function result below this level. This level of z-score of -1.645 is an estimate of the lower 5th centile for the 'normal healthy population'.
Lung function tests are usually undertaken on patients who have some symptoms or signs suggesting to a clinician that there may be an abnormality in lung function. Thus the a priori probability of there being an abnormal result is raised and the lower 90% confidence limit is used as the lower limit of normal (LLN).
However, if lung function tests are being undertaken on subjects where there is no a priori expectation that they will have an abnormal result a LLN of z-score = -1.645 is inappropriate since the false positive rate for stating a result is abnormal will be unacceptably high at 5%. In these circumstances the LLN should be a z-score = -1.96 which is the lower 95% confidence limit and an estimate of the 2.5th centile (false positive rate 2.5%).
For patients it is customary to use the lower 5th centile as the LLN which means accepting a reduced specificity but a greater sensitivity in identifying abnormal results which is acceptable because of the raised a priori probability of there being an abnormal result.
For the example patient from above with a FEV1 z-score of -3.3 this is clearly below -1.645 and so the result is unusual suggesting their FEV1 may be abnormal.
Defining exact cut-off values from z-scores can seem arbitrary and it is probably better to have lung function results expressed as the centile value rather than a z-score. How the centile value relates to a normal population is then explicit to the user. This can help a clinician explain to a patient how their result relates to expected values. In some clinical circumstances a clinician may be prepared to change a patient's management using a different centile cut-off because of the particular probabilities relating that individual.
Copyright © 2023 Prof MR Miller - All Rights Reserved